What household products cost, and how their prices have changed.
List prices and specs for 21,324 popular brand-name products, from the Instant Pot and KitchenAid mixer to the Stanley Quencher and LEGO, plus official price trends since 2010 and the best times to buy. Explore price insights or pick a year to see what was in every shopping cart.
Shop by department
All departments- Household & Appliances 7,074 products
- Electronics 2,501 products
- Sports Nutrition & Protein 1,237 products
- Apparel & Accessories 1,050 products
- Health, Beauty & Personal Care 1,037 products
- Toys/Games 1,021 products
- Coffee Makers 940 products
- Mobile & Computer Accessories 917 products
- Makeup & Skin Care 822 products
- Outdoors/ Sports/ Garden 693 products
- Smart Home 470 products
- Video Games & Consoles 385 products
Product showcase
Shuffle again20 products picked at random from our catalogue of 21,324. Reload the page for a new selection.
Pine-Sol Multi-Surface Cleaner, Lavender Clean, 24 oz
Popular 2015–2025List price ≈$3.99
amFilm Tempered Glass Screen Protector 3 Pack for iPhone 7 Plus/8 Plus
Popular 2014–2020$7.19List price$7.9910% off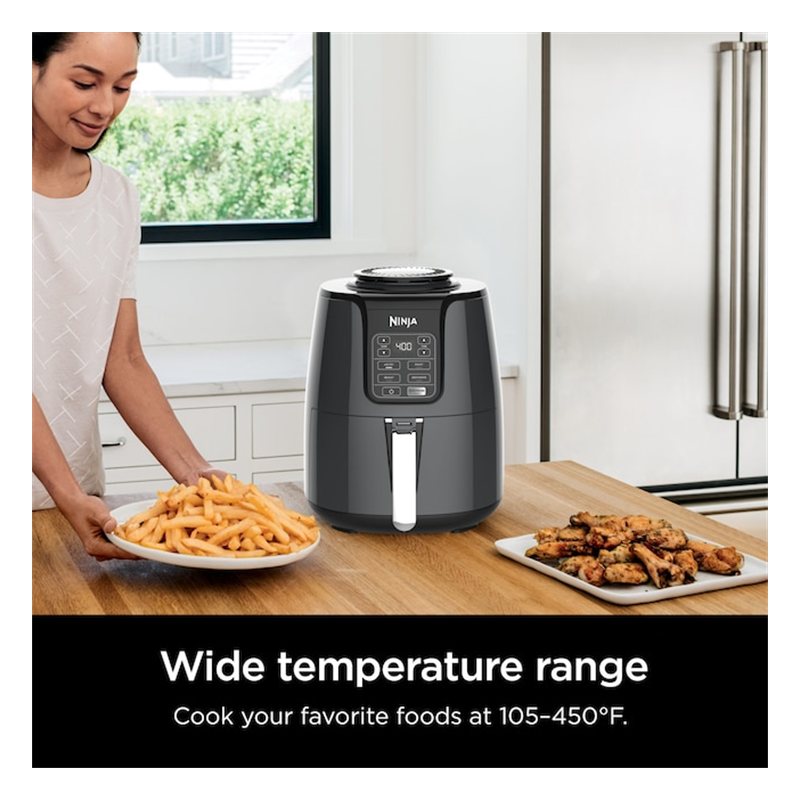
Ninja Air Fryer, 4 Quart AF101, Black
Popular 2018–2020$86.99List price$99.9913% off
Carhartt Detroit Jacket, Moss
Popular 2020–2025List price ≈$189.99
Ray-Ban Aviator Classic RB3025 Sunglasses, Black/Green
Popular 2020–2025List price ≈$171.00
Ninja CREAMi Ice Cream Maker, Deluxe 11-in-1 XL NC501, Cloud Blue
Popular 2021–2025List price ≈$249.99
Owala FreeSip Insulated Stainless Steel Water Bottle with Straw, 24 oz, Night Safari
Popular 2022–2025List price ≈$27.99 NFL
Jacksonville Jaguars Old Fashioned Hot Air Popcorn Maker
$29.99List price$75.9960% off
Premier Protein Cereal Chocolate Almond
Popular 2015–2025List price ≈$5.99
Tile Bluetooth Tracker, Mate 4 Pack
Popular 2014–2020$61.99List price$69.9911% off
Utopia Bedding Bed Pillows 2-Pack, Gusseted, King
Popular 2016–2025List price ≈$29.99
Shark FlexStyle Air Styling & Drying System, 5-in-1 HD440, Deep Rose
Popular 2022–2025List price ≈$299.99
Caraway Food Storage Set 14-Piece
Popular 2021–2025List price ≈$225.00
Threshold Performance 400 Thread Count Sheet Set, White, Full
Popular 2015–2025List price ≈$54.99
Gillette Labs with Exfoliating Bar
Popular 2020–2025List price ≈$21.99
Spigen Liquid Air Armor Case for iPhone 8
Popular 2017–2019List price ≈$14.99
Amazon Fire Max 11 Tablet, Hello Teal
Popular 2020–2025List price ≈$229.99
Zojirushi Stainless Food Jar SW-HAE55
Popular 2015–2025List price ≈$34.99
Crock-Pot Programmable Slow Cooker with Digital Timer, 7 Quart, Stainless Steel
Popular 2010–2020$55.99List price$59.996% off
Mr. Coffee Cocomotion Hot Chocolate Maker by Mr. Coffee
$22.99List price$49.9954% off
Price guides
All price guides- Is it a good Black Friday deal?Normal list prices for TVs, laptops, consoles, appliances and more, to check deals against.
- How Much Does a Laptop Cost? Laptop Price GuideLaptop prices span a wide range, from basic Chromebooks to high-end MacBooks, gaming and creator machines. The biggest p…
- How Much Does a Roku Cost? Streaming Device Prices ComparedStreaming sticks and boxes are one of the cheapest ways to make any TV smart. Roku, Amazon Fire TV, Google Chromecast an…
- How Much Do Game Consoles Cost? Xbox, PlayStation & Nintendo PricesConsole prices depend on the platform and the version: digital-only editions without a disc drive cost less, and "Pro" o…
- How Much Does a TV Cost? TV Prices by Screen Size and BrandScreen size is the biggest factor in what a TV costs, followed by the panel technology (LED, QLED, Mini-LED or OLED) and…
- How Much Does a Refrigerator Cost? Fridge Prices by TypeRefrigerator prices depend mainly on the style (top-freezer, bottom-freezer, side-by-side, French door or 4-door), the c…
Price insights
All price insights- +48%overall US consumer prices since 2010
- −88%Televisions since 2010
- −78%Phones & phone hardware since 2010
- +45%Food at home since 2010
- How Household Product Prices Have Changed Since 2010Official US price data for 19 product categories, from TVs and small appliances to toys and cookware, compared with overall inflation.
- Household Products That Got Cheaper Over TimeThe product categories that cost less today than in 2010, and the ones that got cheaper once inflation is taken into account.
- Are We Paying More Than 10 Years Ago? 2025 vs 2015How much more (or less) shoppers pay for popular product categories than a decade ago, compared with overall inflation.
- When Is the Best Time of Year to Buy Household Products?A month-by-month guide to the sales seasons for TVs, appliances, mattresses, linens, toys, tools and more.
- What Popular Household Products Cost: List Price Ranges by CategoryTypical list prices for more than 200 product categories in our catalogue, from coffee makers to cordless vacuums.
- Product Price Inflation CalculatorSee what a product bought in any year since 2010 would cost today, using official price data for its category.
Popular brands
Brands A–Z- Apple 687
- Amazon 400
- Cuisinart 379
- KitchenAid 304
- SharkNinja 296
- Samsung 288
- LEGO 245
- Sony 228
- Simply Good Foods 217
- YETI 217
- Google 183
- Anker 179
- Dyson 171
- Breville 170
- JBL 165
- Keurig Dr Pepper 164
- Bose 145
- Keurig 144
- Stanley 140
- Dash 127
- Hydro Flask 127
- Nintendo 127
- OtterBox 126
- Zojirushi 117
- Mattel 114
- Le Creuset 111
- Nike 103
- Bedsure 100
- Delta 93
- Lululemon 93
What you’ll find on Savings Ahead
Savings Ahead is a source of price information for popular household products sold in the USA. Each product page brings together the manufacturer’s model number, the list price, the key features, the full specifications and context on how prices in its category have moved, so you can judge a price before you buy anywhere. Our price insights track official US price data for 19 product categories since 2010.
The catalogue focuses on the products people bought most between 2010 and 2025: multicookers and air fryers, Stanley tumblers and Owala bottles, cordless stick vacuums and robot vacuums, smart speakers and video doorbells, insulated bottles, weighted blankets, building sets and collectible toys. Browse by department, by brand, or by the year a product was at its most popular.
Looking for ways to spend less? Read our guide on how to save money on household products.